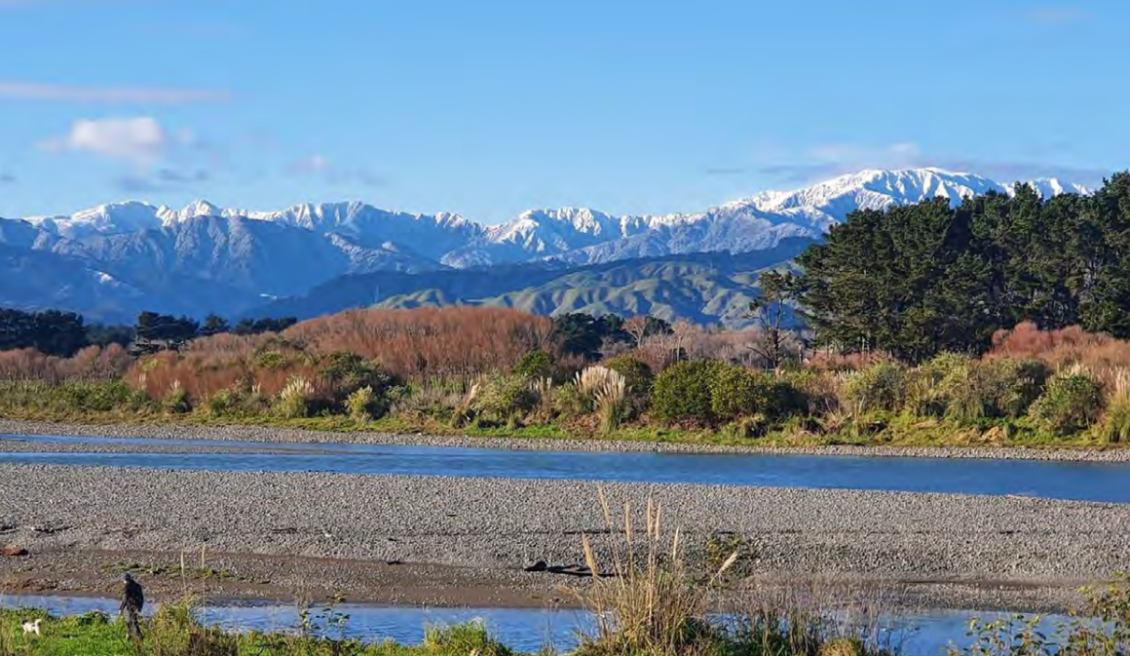
The Ōtaki River catchment drains about 400 square kilometre of the steep western slopes of the Tararua Ranges -- an area stretching from Mount Aston in the south to Mount Pukematawai in the north.
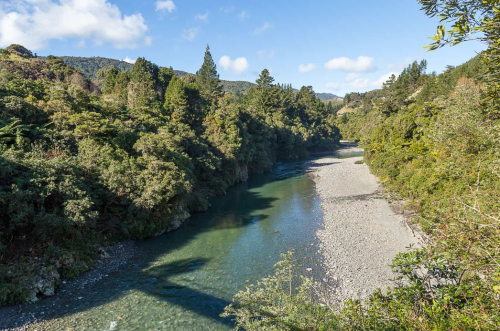
The river is joined by two major tributaries at Ōtaki Forks and flows through deep valleys and gorges in the foothills to the coastal plain, where it meanders to the Tasman Sea between Te Horo and Ōtaki townships.
Human influences on the floodplain, such as forest clearance, urban settlement and some river management practices, have resulted in significant changes to the landscape. These changes, combined with natural floods, have created a flood hazard. Even with the protection that was put in place between 1945 and 1955, following a series of floods during the 1920s and 1930s small to medium-sized floods continue to cause damage.
We oversee river management activities including gravel extraction, erosion prevention and repair works, and maintenance of stopbanks that have reduced the flooding risk to the Ōtaki community.
Following Budget 2024, Greater Wellington and MBIE’s Regional Economic Development and Investment Unit, Kānoa, have agreed to co-fund 16 flood resilience projects as part of a nationwide initiative. The programme spans 16 sites across Wairarapa and Ōtaki and are critical in future proofing community, infrastructure, cultural taonga and the economy, following a major flooding event. The project in this region is the Ōtaki Cliffs project. Find out more.

Get in touch
- Phone:
- 0800496734
- Email:
- info@gw.govt.nz